
The idea of mapping an ecosystem is to look at all of the stakeholders that exist within a system with the goal of gaining a better understanding of who and what it takes for the environment to function and progress to be made. The mapped information can illuminate the simplicity or complexity, the strengths or risks, and the power dynamics that exist within an ecosystem.
Seeing all of the stakeholders organized by functions and roles provides the ability to identify gaps, opportunities, and saturation with a system. Essentially, a mapped ecosystem is a data-informed tool that provides decision makers with the knowledge and visibility to determine where, or where not, to focus their efforts.
For more background on ecosystems, take a look at the overview and how to create an ecosystem.
To illustrate the value and use of an ecosystem map, we are sharing a case study with you. Prosono worked with a corporate foundation client who has focused on financial literacy for over 15 years and was an early adopter of this cause area Initially, having a financial literacy curriculum was enough for a business or nonprofit to demonstrate their involvement in this cause area.
Since they began their work in financial literacy, many other stakeholders have entered, policies have changed, consumer needs have shifted, language has evolved, and the landscape is far more complex. Mapping the financial literacy ecosystem was valuable to refresh their view of the stakeholders and understand which functions and roles they occupy, and where opportunities exist to make a quantified and meaningful impact.
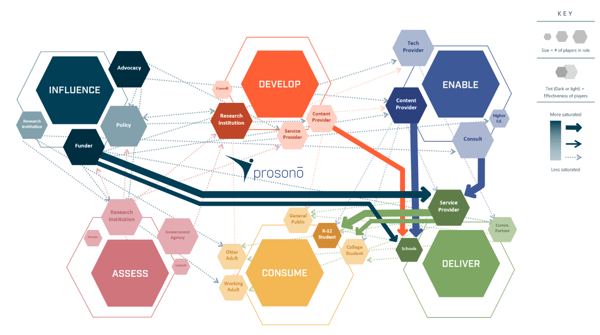
In the fall of 2019, Prosono compiled and mapped the national data for the financial literacy ecosystem. A representation of the full map is below. To break down the details of the ecosystem map and the stakeholder relationships, note the following:
- the largest hexagons are the functions (influence, develop, enable, deliver, consume, and assess)
- the smaller hexagons, (in the similar color tones to the larger hexagons) are the roles for their respective function
- As indicated in the legend, the size of the role hexagons is relative to the number of stakeholders that serve in the role
- the darker the color of the role hexagons signify the validity of the work of the stakeholders based on thought leaders, peers, and practitioner’s evaluation
- the thickness of the lines represents the number of stakeholders that interact from role to role
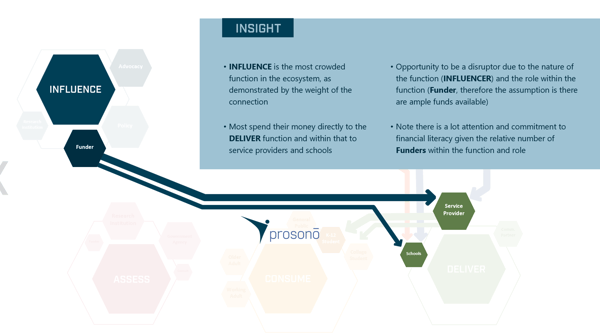
Narrowing in on the insights and what the map represents, we focused first on where the largest amount of players in the ecosystem operate, or the dark blue lines. The largest number of players, or saturation, in this ecosystem is from the function of “influence” to the function of “deliver” and more specifically from the role of “funder” to “service provider” and schools (represented as the smaller icons labeled “K-12” and “College Students”). The size of the “service provider” and “schools” hexagons represent how many stakeholders are providing financial literacy curriculum to consumers.
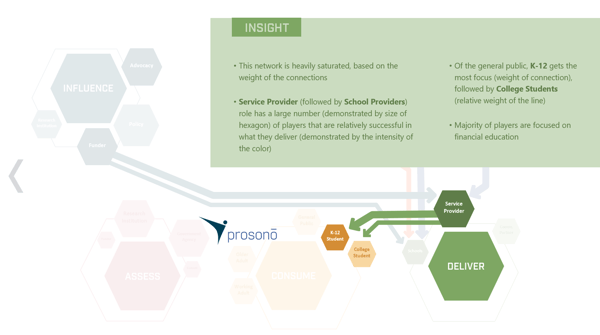
Continuing with the insights, we also looked at the sheer number of stakeholders that are operating as “service providers” and delivering their financial literacy curriculum. The bulk of the service provider stakeholders deliver their proprietary content to K-12.
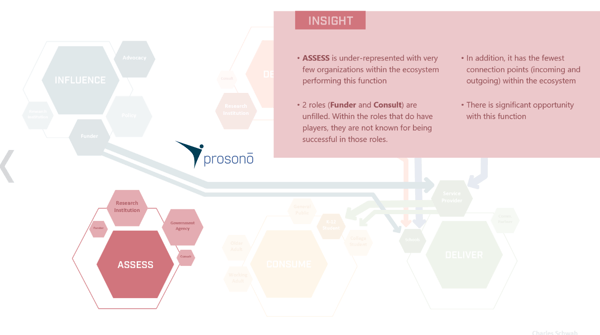
We then looked where there are little to no players in a function and/or role. At the time of this data collection, there were the least number of stakeholders operating in the “assess” function with two roles primarily sitting vacant: “funder” and “consult”. The absence of stakeholders in this function and these roles present great opportunity within the ecosystem. This is a key opportunity to make progress in the financial literacy social impact cause area.
After reviewing the map and data within, our client was able to see where they sit and what space(s) they are considered leaders of. From there they were able to review their assets and look through a different lens at where their focus could make a quantified and meaningful impact.
If you want to discuss how an ecosystem map can help your organization contact us at prosono@prosono.com.